A Hierarchy of Needs to Live Your Best #DataLife
Maslow’s Hierarchy of Human Needs provides a useful framework for understanding the drivers of behaviors. He recognized that basic needs must be met before higher level functions can happen. He also identified that once a need is met, it becomes an expectation.
Plateresca / Getty Images
Can we apply a similar framework to our life with data?
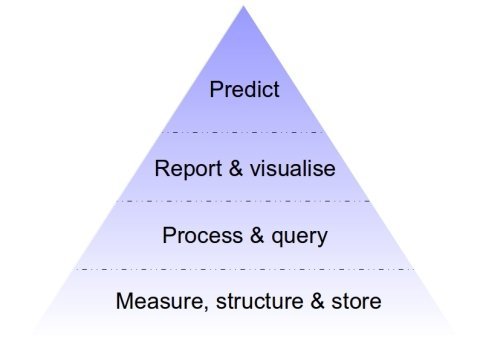
I’m far from the first person to ask this question. However, the data-oriented “Hierarchies of Need” tend to focus on the needs and capabilities of the organization. Here are a couple of examples:
https://medium.com/@hugh_data_science/the-pyramid-of-data-needs-and-why-it-matters-for-your-career-b0f695c13f11
As is so common in the analytics space, the focus is on technology and capabilities. If you are the CDO or CTO, this may provide a useful roadmap. It is less so if you are a data analyst, operations manager, or student learning how to work with data.
We’ve always been more interested in the human side of data. What do people need? What are the pains and concerns when it comes to using data? That’s why we are hell-bent on making the most human-friendly creative tool for expressing with data.
This is where my “DataLife Hierarchy of Needs” fits in — it highlights the ascending needs for an individual to make use of data. We’ve talked to hundreds of people who are using data in their jobs. Similar themes come up again and again, and this structure helps explain where people get stuck.
A quick tour of the levels:
Level 1: Physiological needs, i.e. get the data
Nothing happens if you can’t get your hands on the data. And once you have the data, you need to make sure it is accurate, understood, cleaned, and structured for analysis. Like the basic needs for food and shelter, this is the place where the under-served and under-resourced people run into a barrier. The challenge of not knowing how to define data requirements is sometimes enough halt any movement up the pyramid of needs.
Level 2: Safety needs, i.e. the confidence to work with data
Long before anyone can express themselves with data, they need to develop foundational data analysis skills. These skills include: combining data sources, being able to define important metrics, and choosing the right charts to explore and express data.
Without this sense of confidence, they won’t feel safe moving forward into finding and sharing insights in a social environment.
Level 3: Love and belonging needs, i.e. engaging with the broader organization
The work of data exists in a social environment. The next step up the pyramid is when we understand how our use of data starts to impact the people around us. This is where we expand outside ourselves to start to consider the audience, the priorities of the organization, and how to best visualize data for understanding.
Social and communication skills become increasingly important as we move to higher level needs. It was 15 years ago (!) that I wrote that the problem of analytics “isn’t a technical problem, it’s a social problem.”
Level 4: Esteem, i.e. pursuing recognition for the data insights
At last, it is time to become a data author, a creator of data products. With the skills and data access, you can look for ways to express your insights through data stories, design repeatable reports, and manage who gets access to the data and how they receive it. The social capabilities from the previous level gives you direction to know what you should create from data.
Level 5: Actualization, i.e. achieving action from the data
Ultimately, the goal of using data is to guide informed actions. If your insights are effectively communicated, you have the opportunity to change minds. But you will face resistance from people who have pre-existing assumptions or incentives to push back on the results you share. Perhaps this last level is the hardest of all because it takes subtly and skill to influence others to change how they view their world.


