Are You Cooking or Baking with Data?
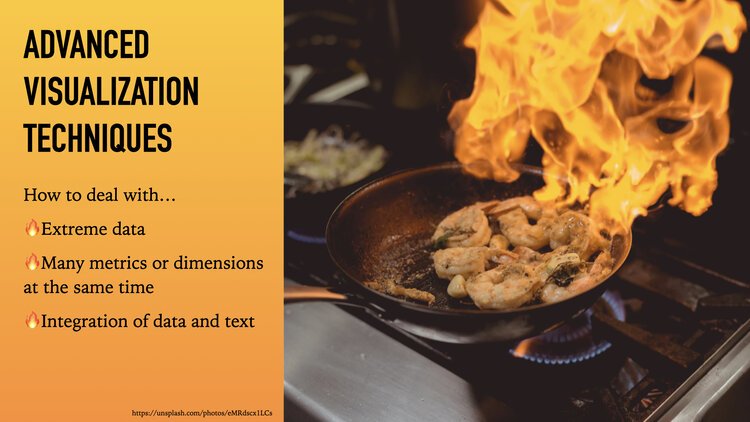
Cooking is one of my favorite go-to analogies for data storytelling and data visualization. There is much in common when you think about the process of transforming raw ingredients into a finished product. Let us count the ways…
Like cuisine, any data visualization is simply the re-mixing of various fundamental elements — points, layout, connectors, and colors.
Picking the right visualization is finding the recipe that will show your data in the best possible way.
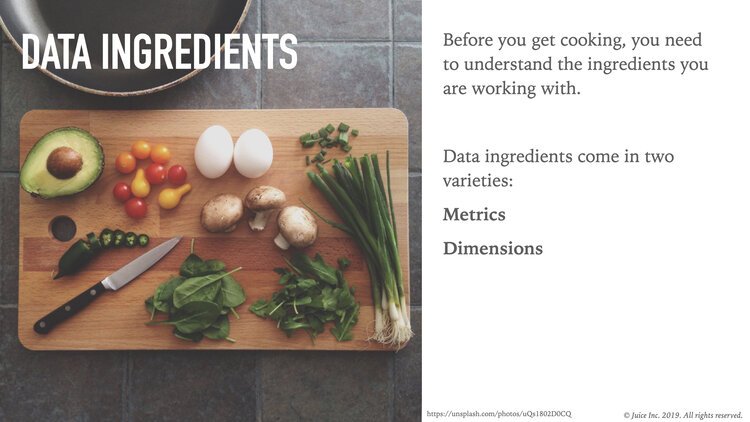
Data provides the raw ingredients for your data visualization. And like ingredients, you need understand what you are working with to ensure the highest quality outcome.
The details of visual presentation are critical when it comes to food and to data.
First learn the basic skills of data visualization before taking on the challenges of advanced techniques.
But there is comparison that I had missed: Cooking vs. Baking. These are two very different skillsets when it comes to food preparation — and they appeal to different types of people.
Cooking is more about free-flowing artistry and unexpected outcomes. You can set off in a particular path, but there is flexibility to re-define on the fly. You need basic skills, but there is plenty of room of in-the-moment creativity.
Baking is different. It is often considered more science than art. You need to get things precisely right — ingredient measurements, baking times, oven temperatures, ratios of wet to dry ingredients — or the whole project can come tumbling down. I know these things from watching the Great British Baking Show.
How does this reflect on working with data?
Sometimes your work can be like cooking with data, exploratory and expressive. Other times you are baking, meticulous and laser-focused.
For example, the work of a data scientist is closer to baking. Precision and patience are paramount. You need a willingness to test, and start over again.
The work of a marketing analytics can be more like cooking. You have a many choices of data to work with and there is lots of freedom to explore different connections.
Of course, there is plenty of room for overlap and crossover. But if you are starting your career in analytics, it is worth asking yourself: Who do I want to be?

