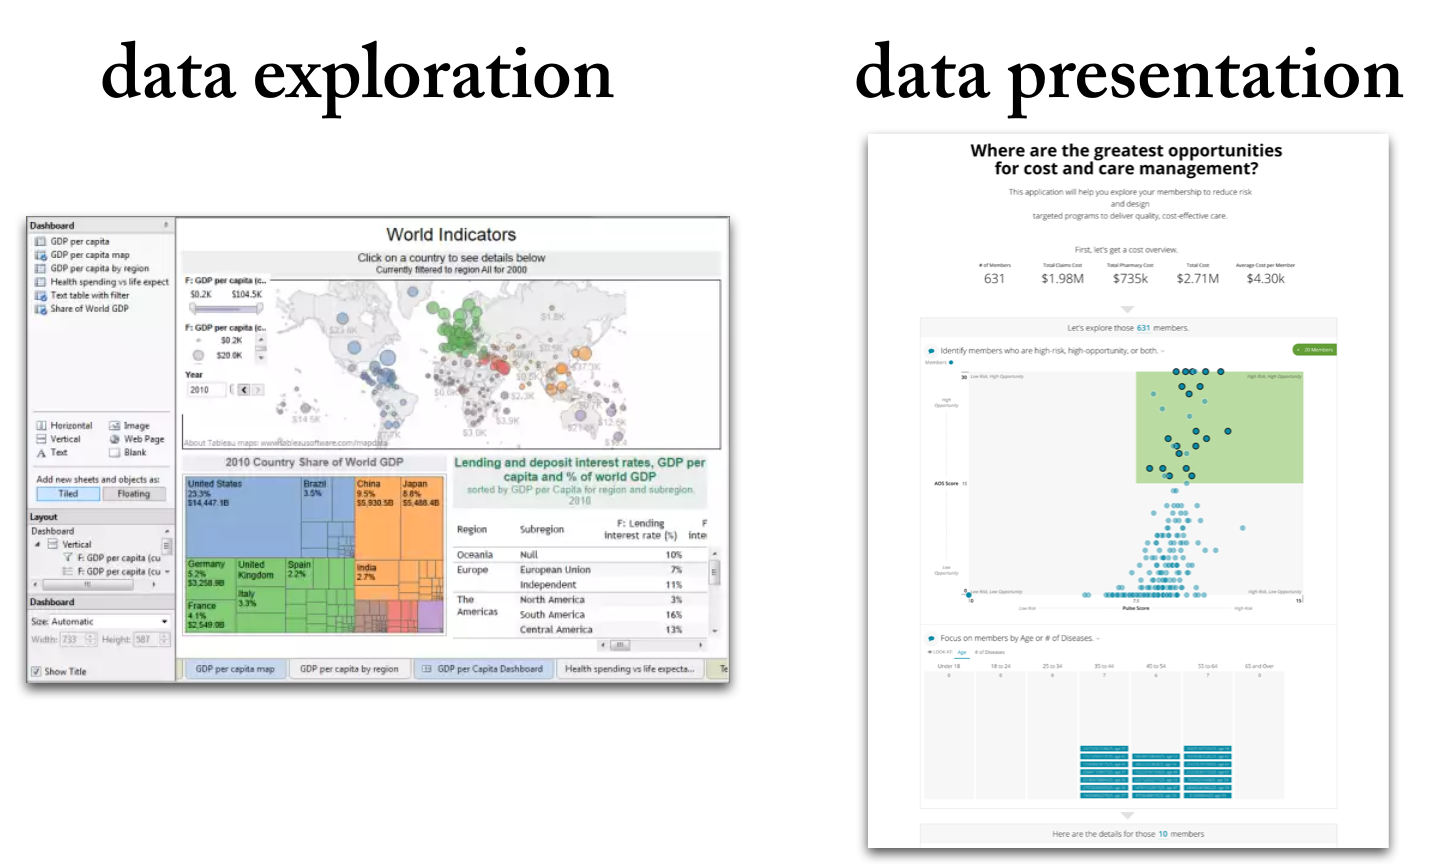
Data Exploration vs. Data Presentation: 6 Key Differences (2026 Update)
Data exploration means the deep-dive analysis of data in search of new insights.
Data presentation means the delivery of data insights to an audience in a form that makes clear the implications.
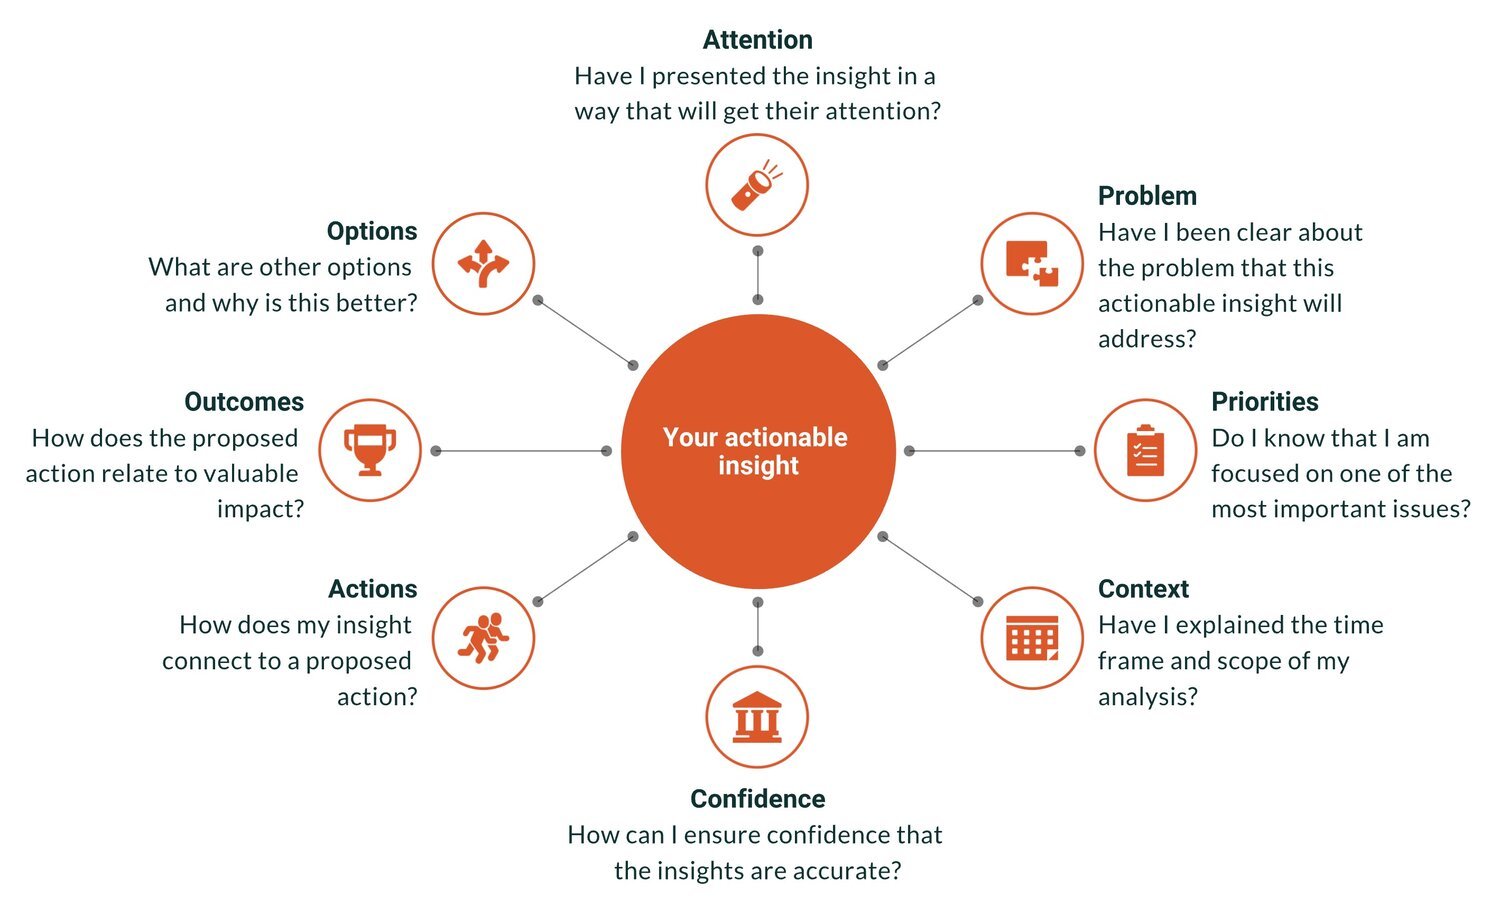
From Insight to Impact: How to Make Data Actually Drive Action
“Actionable insights” is the Holy Grail of analytics. It is the point at which data achieves value, when smarter decisions are made, and when the hard work of the analytics team pays off. Actionable insights can also be elusive — a perfectly brilliant insight gets ignored or a comprehensive report gathers dusts on a shelf.

10 Key Ways Data Products Can Outperform Traditional Reporting in 2026
Explore how customer reporting falls short and why modern data products deliver real value. This updated guide walks data professionals through ten crucial differences, from design and delivery to monetization and user‑focus.
12 Rules for Data Storytelling (Updated for 2026)
Learn the 12 timeless rules of effective data storytelling—refreshed with modern guidance for today’s data professionals.

Are You Cooking or Baking with Your Data?
Some data teams cook. Others bake. The best do both. Learn how to balance agility and consistency in your data storytelling, visualization, and products.

Bridging the Last Mile of Data: Why Communication Is the Real Analytics Challenge
Why the biggest challenge in data isn’t technology — it’s communication. Learn how data professionals can bridge the last mile with better storytelling, products, and insights.

The Strategic Edge: Data Storytelling in Sales Presentations
Learn how sales teams can use data storytelling to build trust, connect with buyers, and win deals. A 2026 guide to replacing static charts with persuasive narratives.
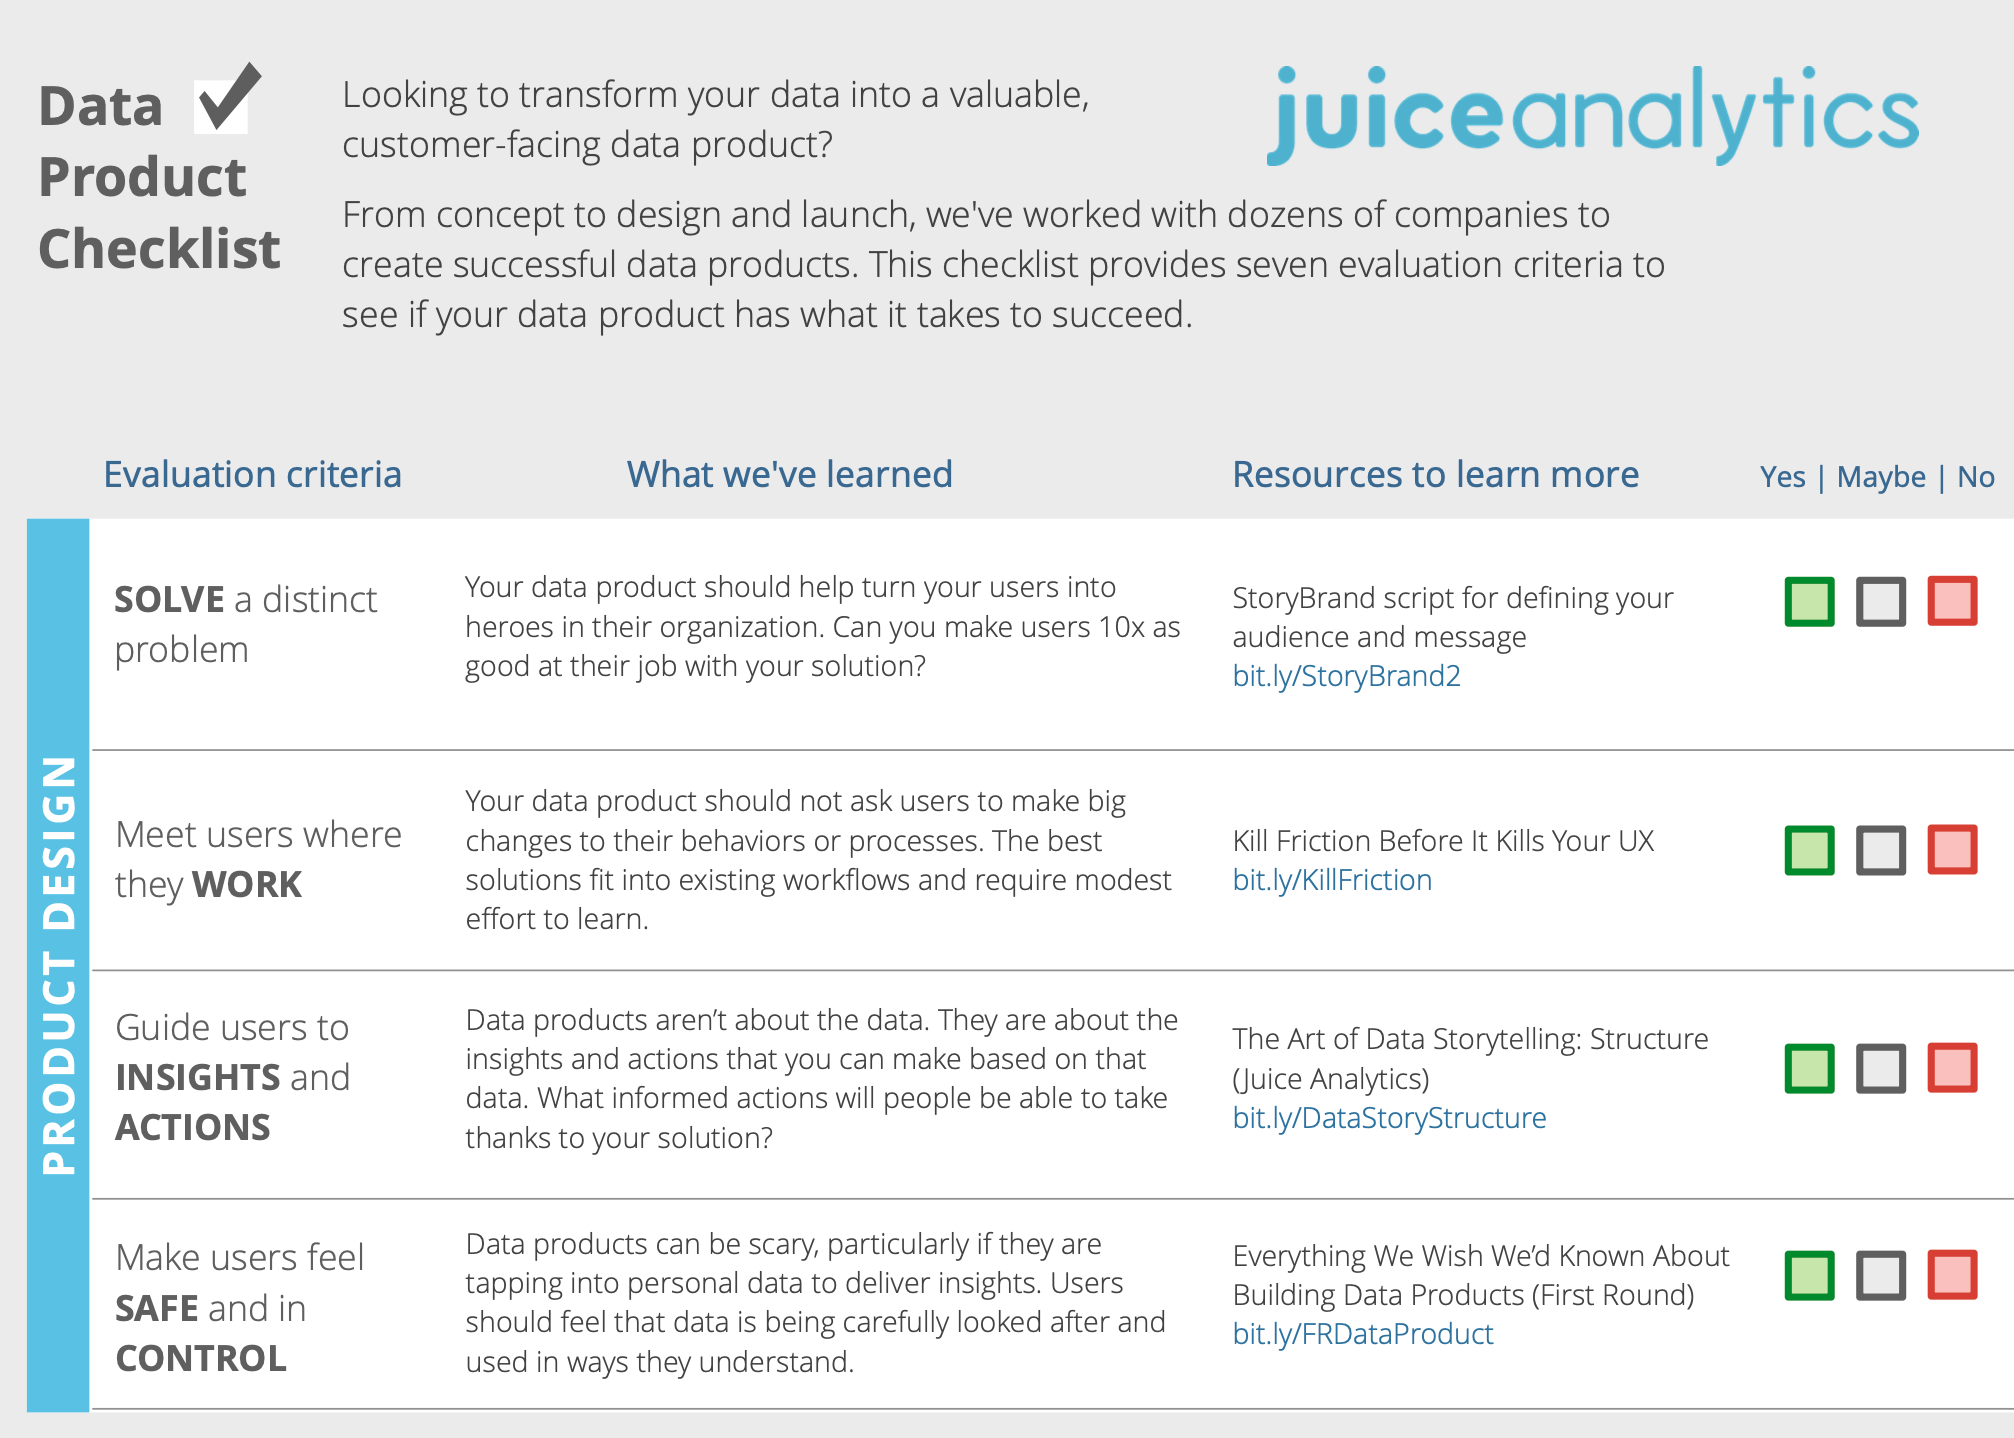
Turning Raw Data Into Gold: A Modern Checklist for Data Product Managers
Learn how to turn raw data into customer‑ready solutions. This updated checklist for data product managers focuses on data storytelling, product design and analytics.
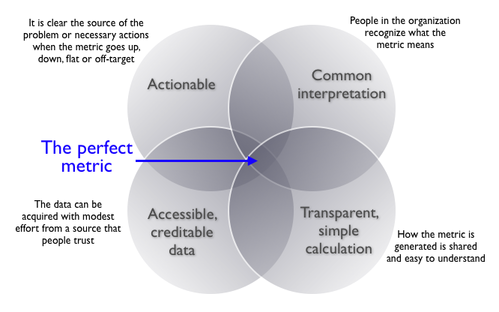
Choosing the Right Metric: A 2026 Guide to Smarter Analytics and Data Storytelling
Choosing the wrong metrics can lead to misleading insights and poor decisions. This post outlines a practical, three-step framework to help you select the right metrics for identifying problems, measuring performance, and guiding action. You’ll also learn the four key traits of effective metrics and how to avoid common pitfalls—plus real-world examples, expert insights, and links to trusted resources.
Why We Need to Tell Better Customer Success Stories

Roger Federer is a Master Data Storyteller
We know Roger Federer is a genius on the tennis court. Now we know he has a touch of genius for data storytelling.

Juicebox Is Now a Databricks Validated Technology Partner
We’re excited to announce that Juicebox is now a Databricks Validated Technology Partner. In fact, we’re currently one of only two patners featured under the Analytics & Business Intelligence use case in the Databricks Technology Partner Directory.
This validation recognizes Juicebox for its performance, scalability, and seamless integration with the Databricks Data Intelligence Platform. Find out more here: Explore Juicebox for Databricks
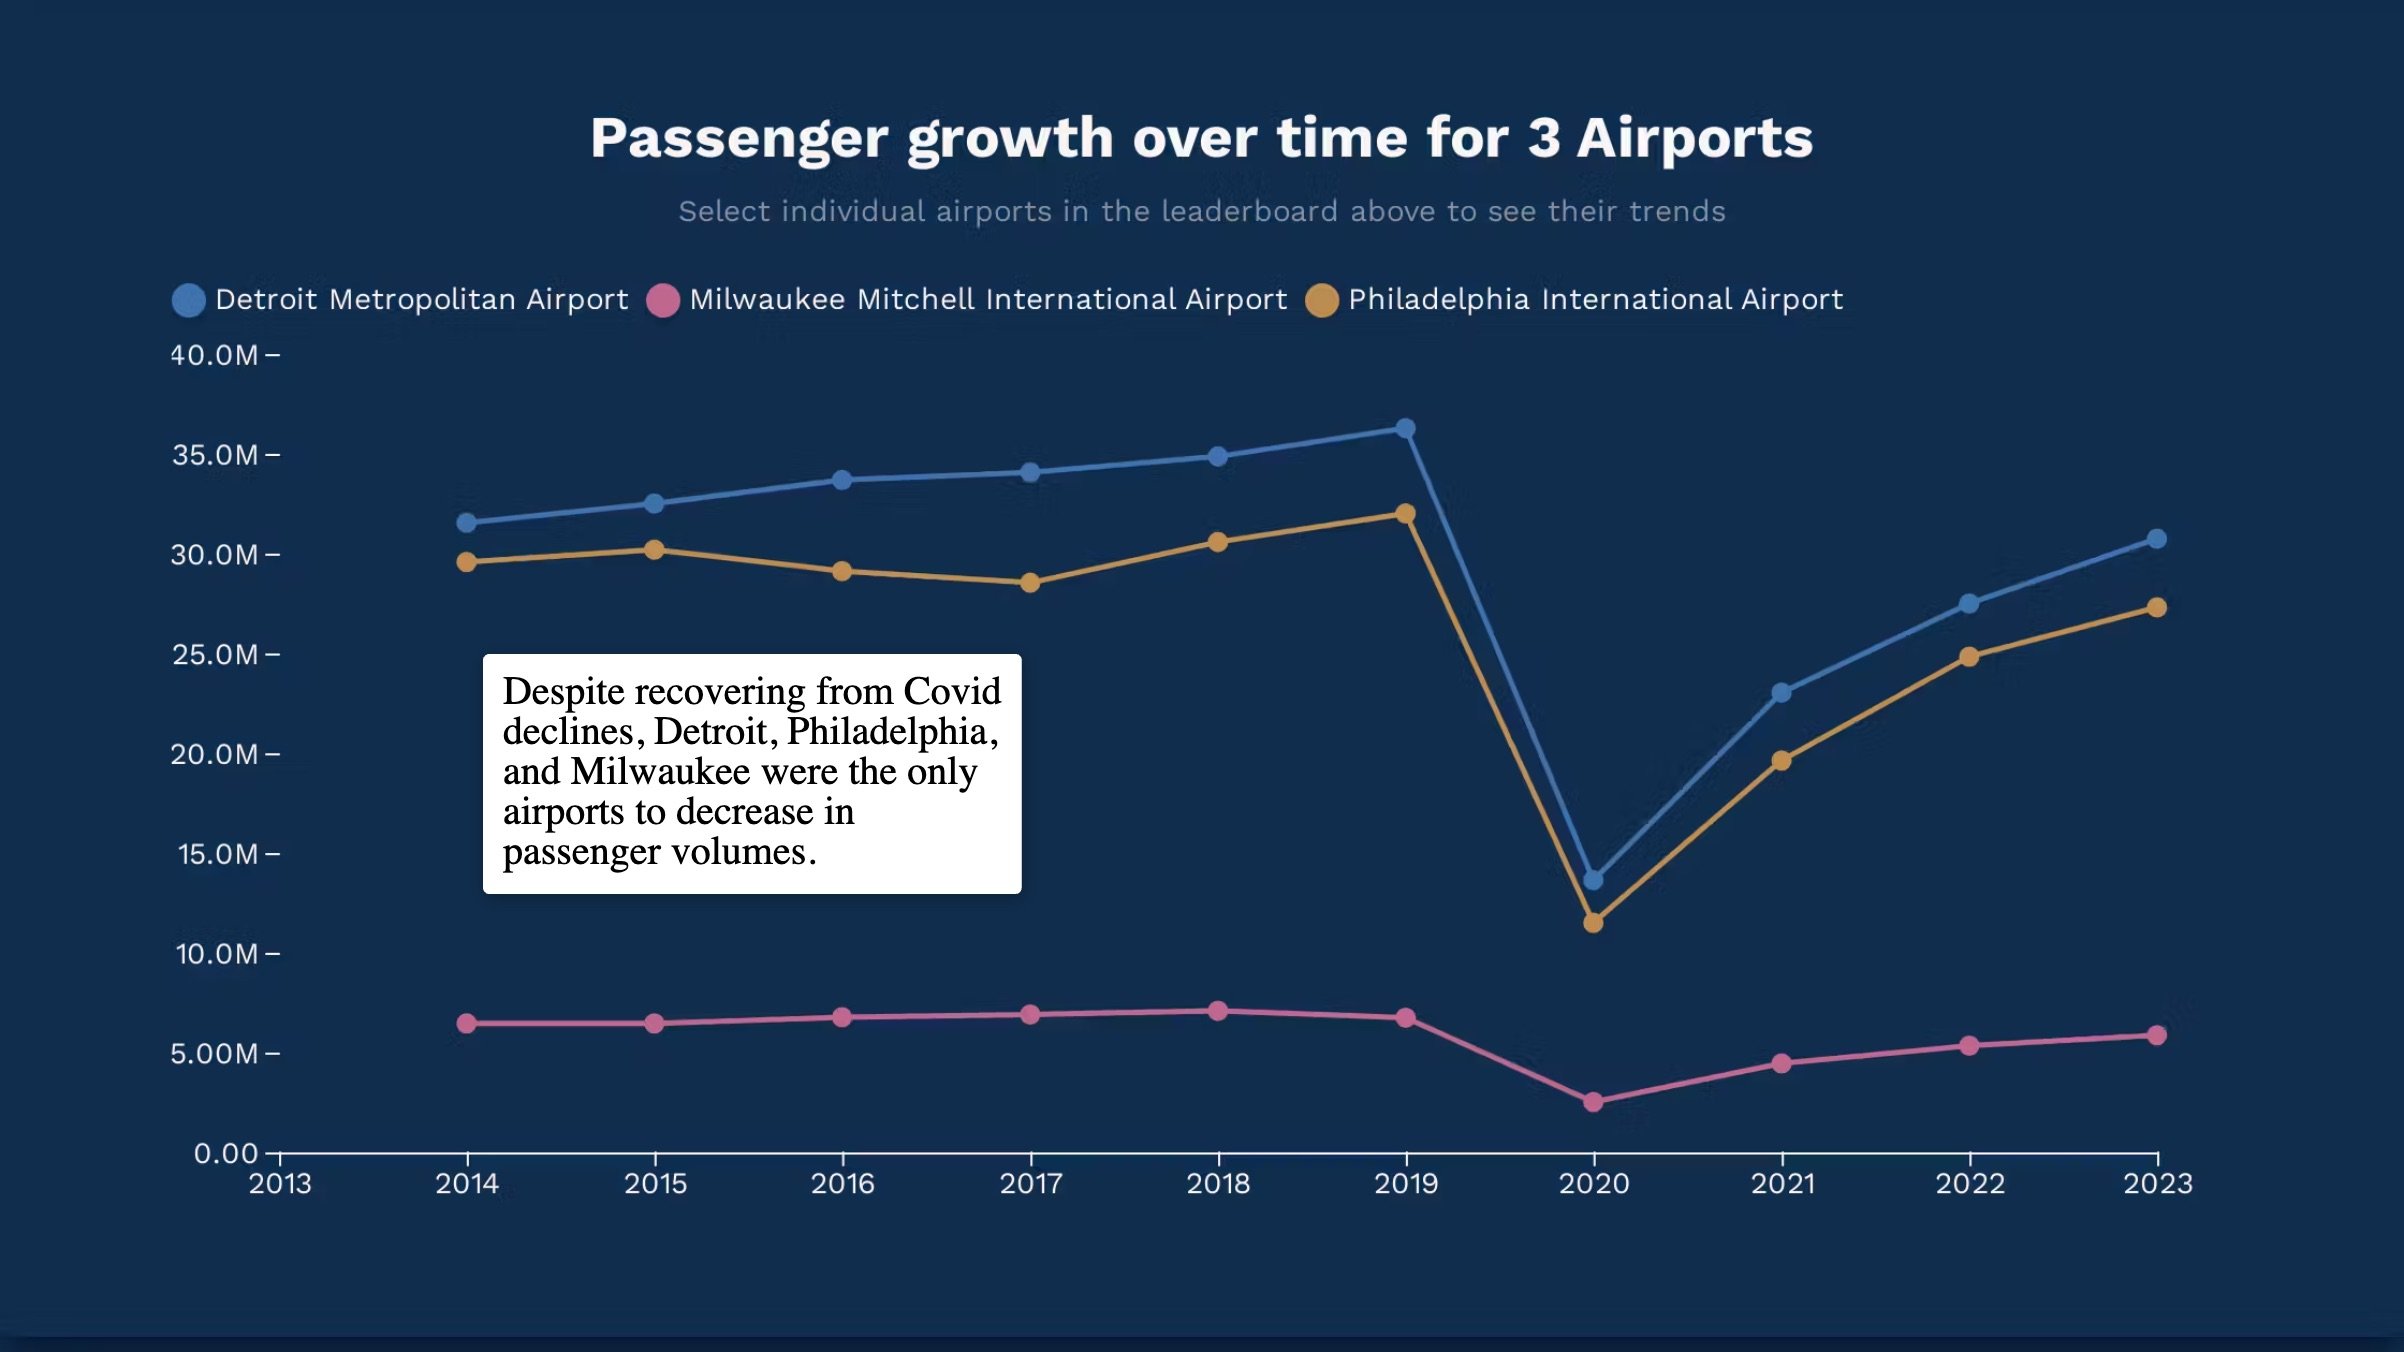
Insights into Airport Traffic
Teaching Data in the Classroom with Interactive Storytelling
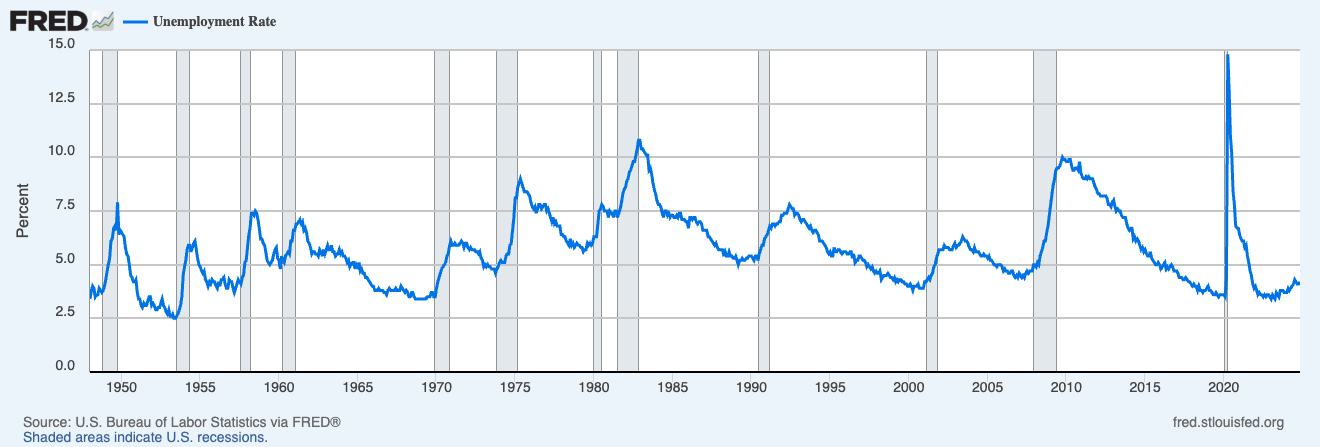
What Does FRED Teach Us about Successful Data Products?
The Last Mile of Data

Holiday Gift Guide for Data Nerds
What a Surprise! Data Storytelling has been alive, and real, all along
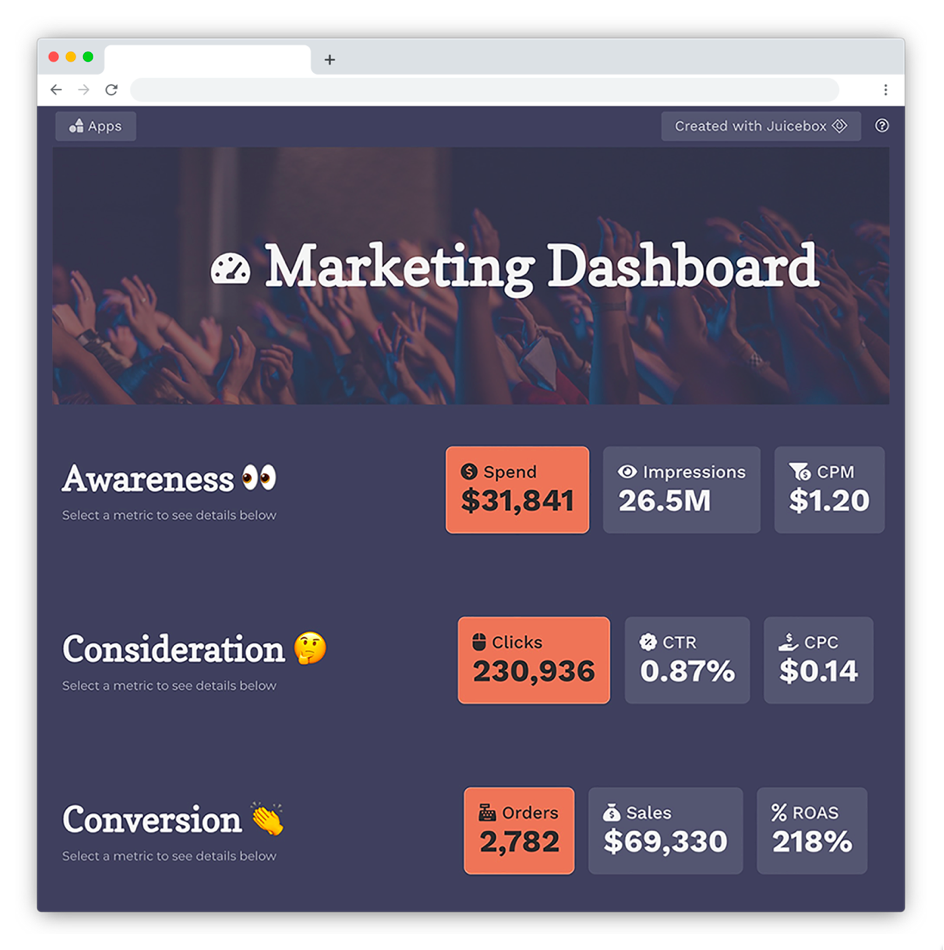
How to Apply Data Storytelling to Dashboards